10 Best Open-Source Monitoring Tools for DevOps in 2024
We're StatusPal. We help DevOps and SRE streamline incident and maintenance communication with a powerful status page that integrates nicely with your monitoring and observability tools. Check us out!.
In 2024, monitoring is essential to modern DevOps teams' work. DevOps teams need reliable and flexible tools to effectively monitor and manage complex systems that can provide real-time insights into system performance, availability, and security.
Open-source monitoring tools have become increasingly popular due to their cost-effectiveness, flexibility, and community support.
Pros and Cons of OSS Monitoring Tools for DevOps
Here are some advantages and disadvantages of open-source monitoring & observability tools compared to SaaS/hosted tools.
Pros
- Customization: Open-source monitoring tools allow for greater customization and flexibility in terms of monitoring configurations and integration with other tools.
- Cost-effective: Open source tools are often free or low-cost, making them a cost-effective solution for organizations with limited budgets.
- Transparency: The code behind open-source monitoring tools is open for scrutiny and can be audited, providing greater transparency and accountability.
- Community support: Open-source monitoring tools are often supported by a large community of developers who provide support and contribute to the development of the tool.
Cons
- Complexity: Open source tools often require more technical expertise and effort to install, configure, and maintain than SaaS monitoring tools.
- Support: While community support is available, it may not always be sufficient for organizations with complex or specialized monitoring requirements.
- Security: Open source tools may be vulnerable to security breaches, as they may lack the robust security features and updates provided by SaaS tools.
- Scalability: Open-source monitoring tools may not be as scalable as SaaS tools, as they may require additional hardware and infrastructure to scale effectively.
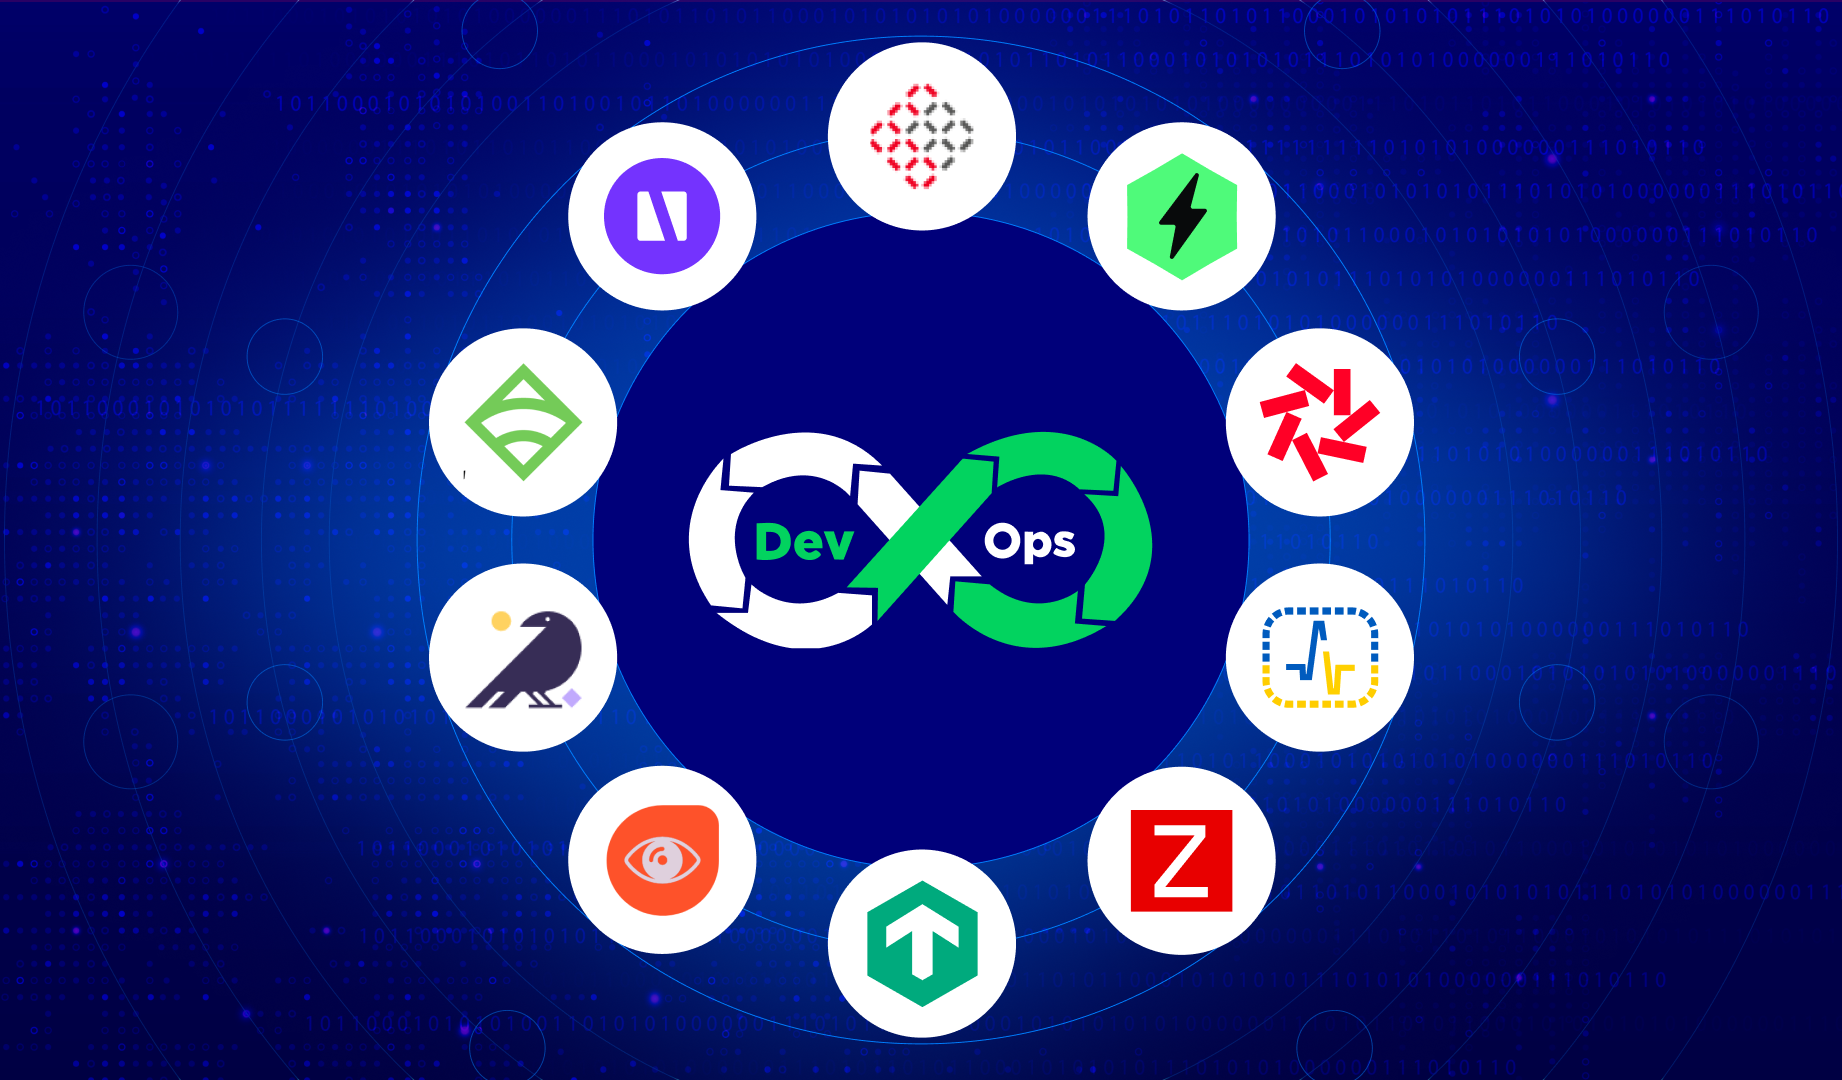
Top 10 open-source monitoring tools for DevOps
We will cover the following open-source monitoring & observability tools that modern DevOps teams should be aware of in 2024:
These tools offer a range of monitoring capabilities, including collecting and analyzing metrics, monitoring logs, tracing requests, and alerting. Each has its strengths and weaknesses, and the best choice for a specific DevOps team will depend on their unique needs and requirements.
Highlight.io
Highlight.io is an open-source, full-stack monitoring platform that offers comprehensive tools for error monitoring, session replay, logging, distributed tracing, and more. It aims to provide developers with a modern, cohesive solution for monitoring applications.
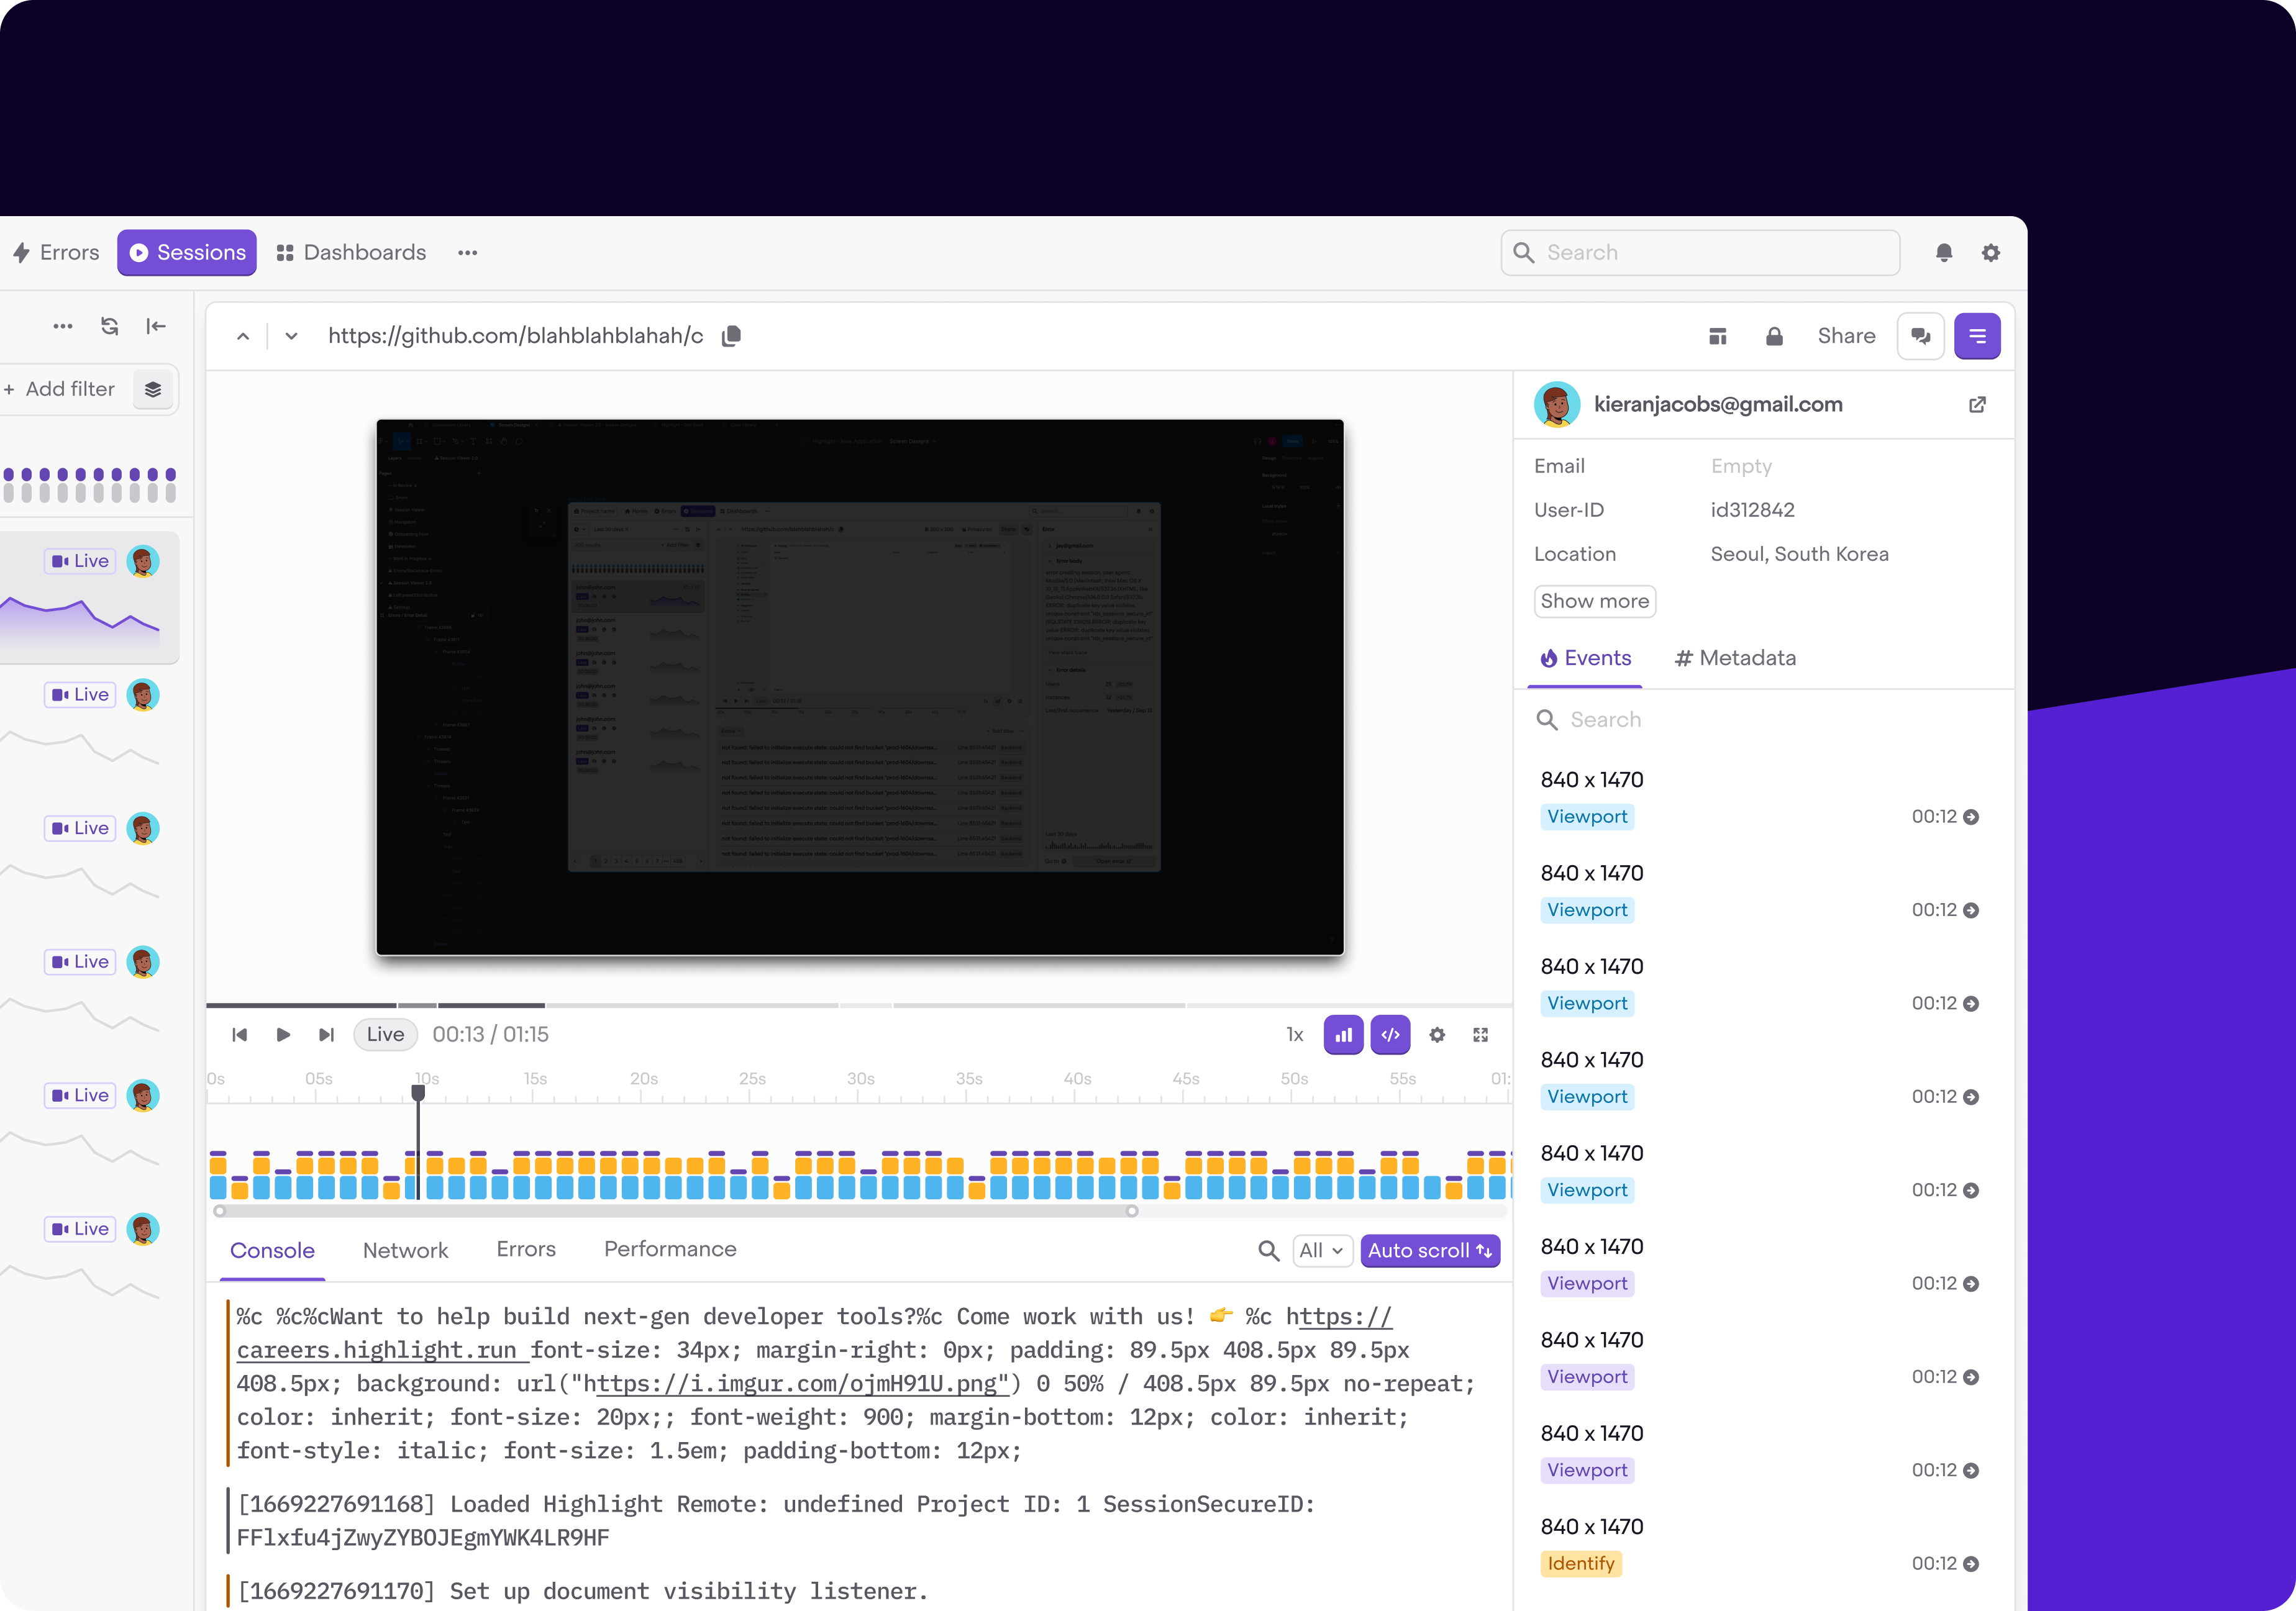
The platform emphasizes ease of installation and usage, offering features like high-fidelity session replays, customizable error grouping, powerful log search capabilities, and integrated tools for tracking server performance. Highlight.io supports various SDKs, making it versatile for different development environments.
Pros
- Open-source and customizable, allowing for flexibility in implementation.
- Comprehensive monitoring capabilities, including error monitoring, session replay, logging, and tracing.
- Supports a wide range of SDKs for different development environments.
- Designed for ease of installation and use.
Cons
- Open-core: this is an open-source version of a self-hosted offering, and as such, comes with some limitations: "We don't recommend hosting Highlight yourself if you have more than 10k monthly sessions or 50k monthly errors".
- It may require a learning curve to leverage its full potential.
- Monitoring effectiveness depends on the proper integration and configuration within the project.
highlight.io Github repository →
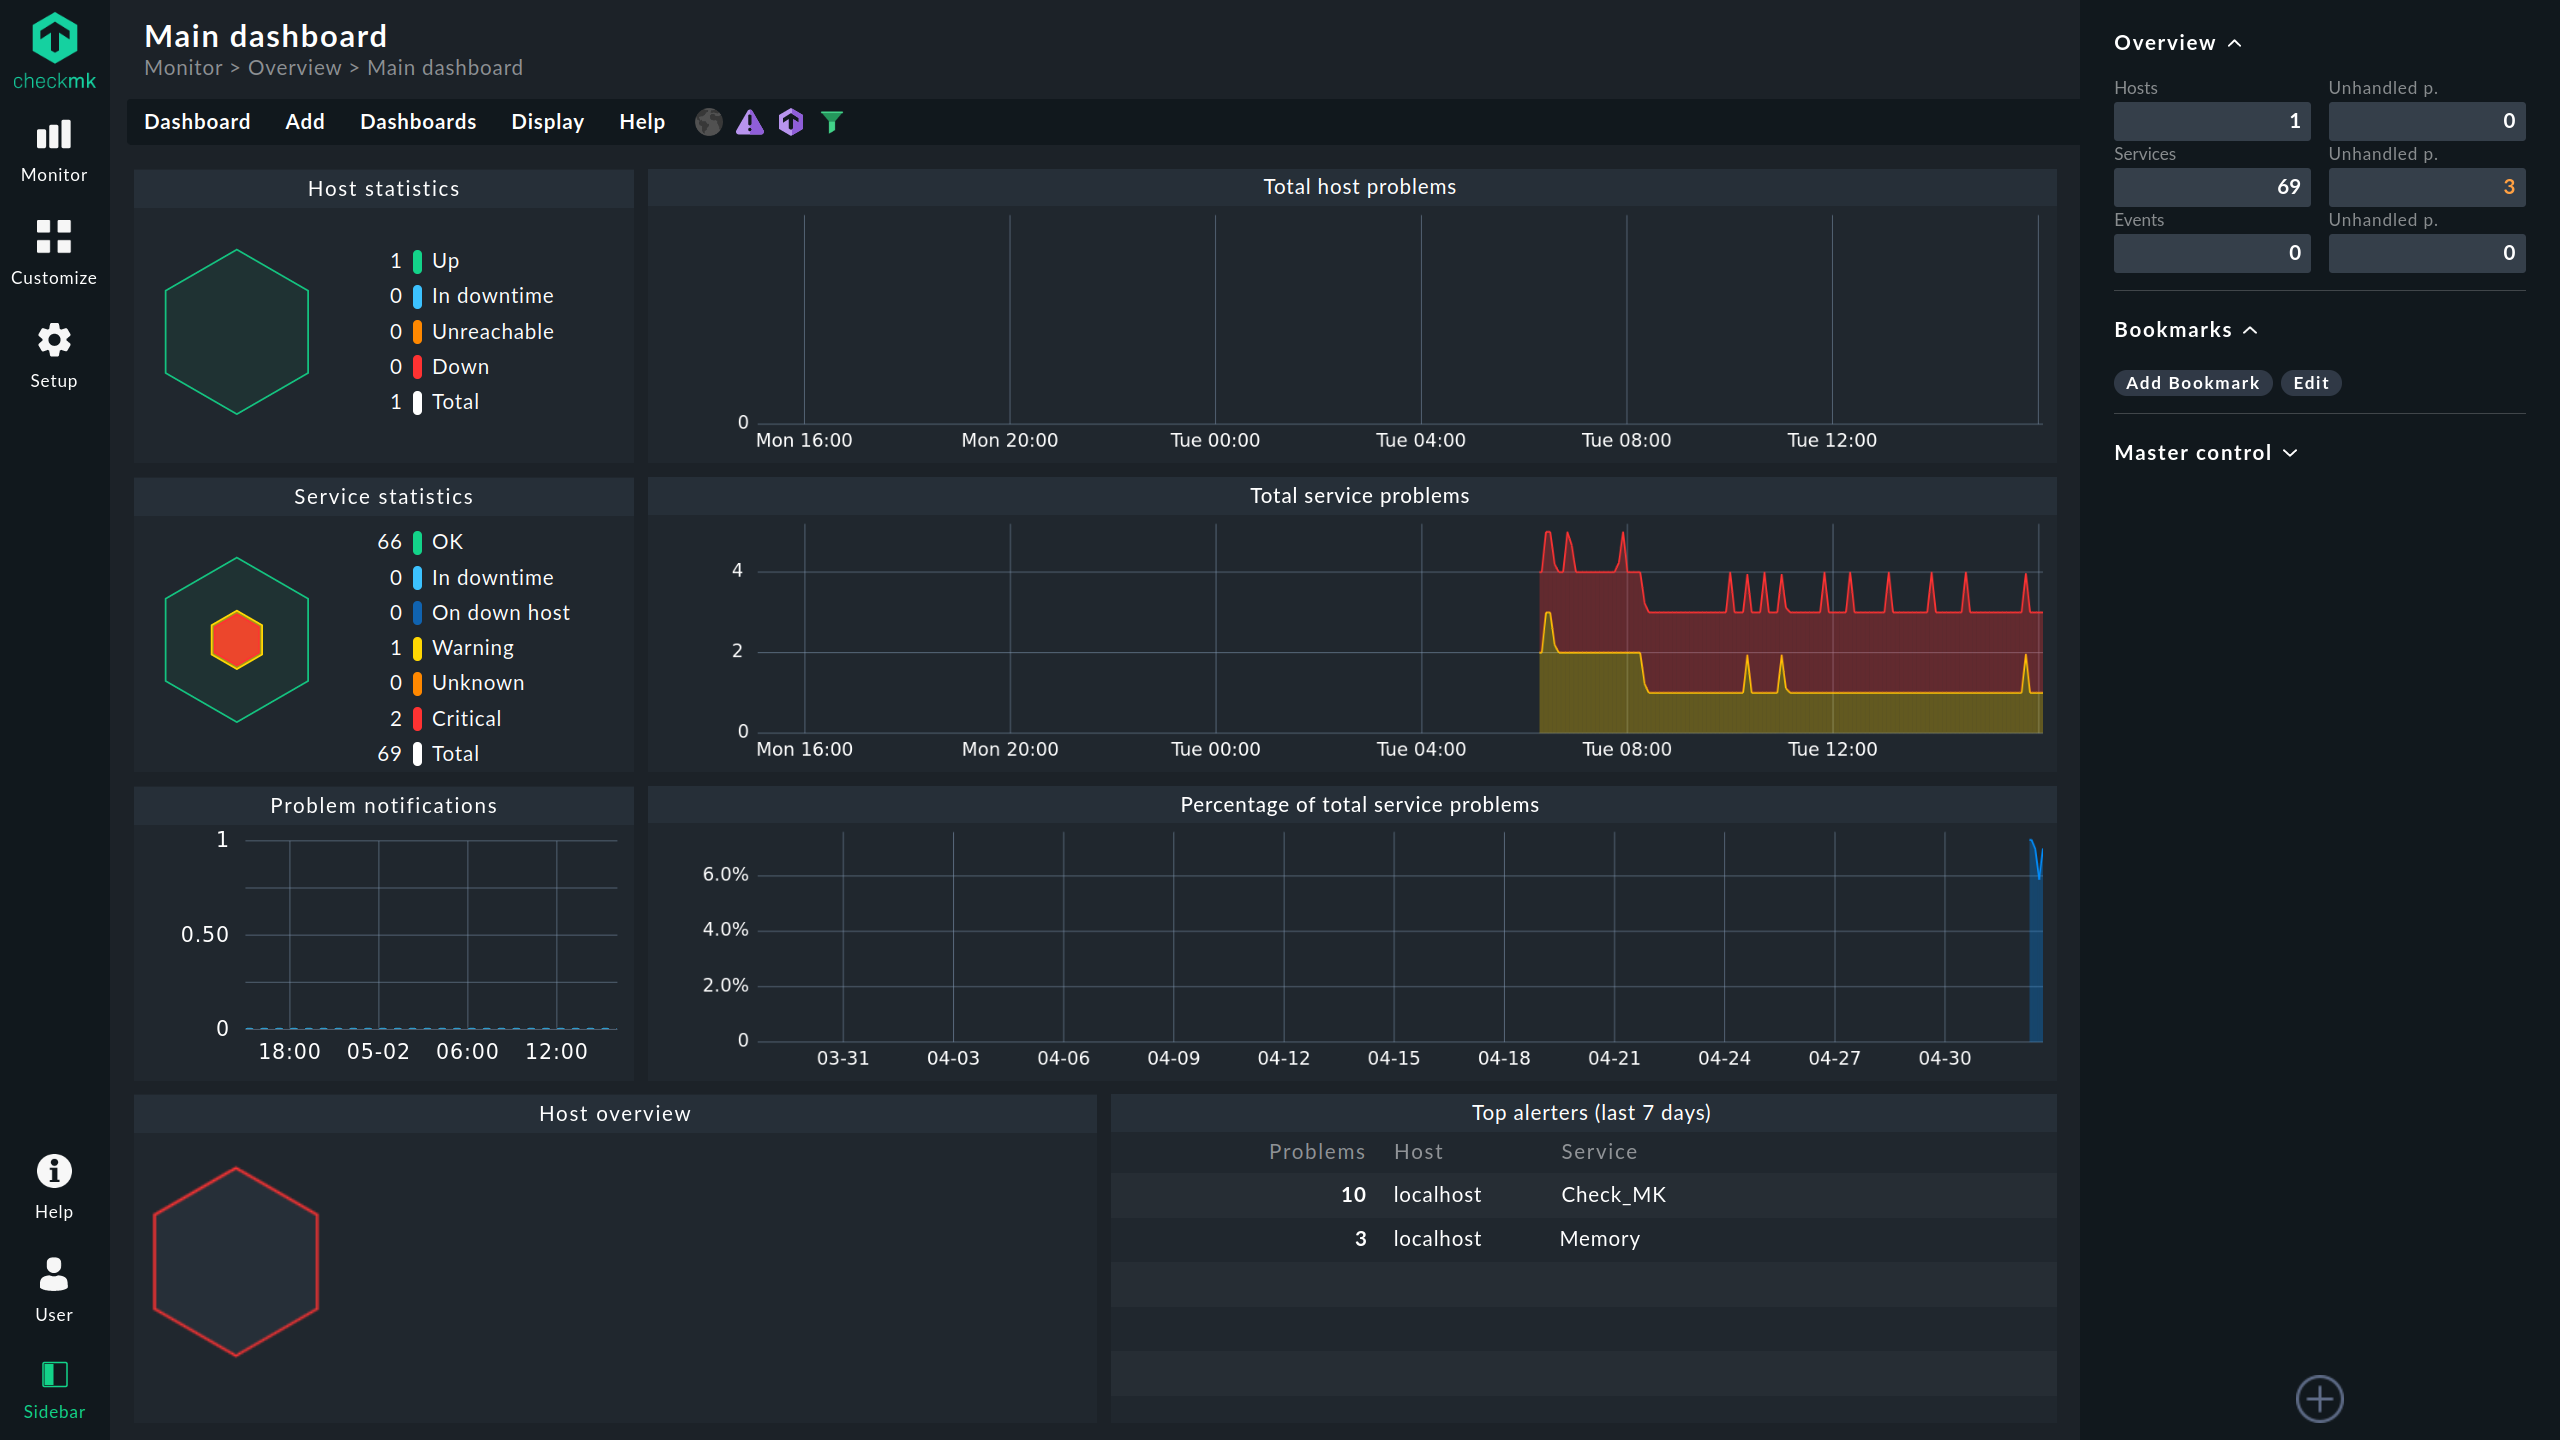
Checkmk
Checkmk is a comprehensive IT monitoring solution available in both a free, open-source Raw Edition and a paid Enterprise Edition with additional features and professional support.
It's designed for best-in-class infrastructure and application monitoring, allowing easy installation on Linux servers. Checkmk is particularly noted for its scalability, flexibility, and wide range of monitoring capabilities.
Pros
- Supports extensive infrastructure and application monitoring capabilities.
- Designed for scalability and flexibility in IT environments.
- Offers both a free, open-source version and a feature-rich paid version with support available.
Cons
- Open-core: The open-source version of Checkmk, known as the Raw Edition, comes with some limitations compared to the paid version; for example, container, Kubernetes, and cloud monitoring are only available in the paid offerings.
- The complexity of features might require a learning curve for new users.
- The Enterprise Edition, while powerful, comes at a cost.
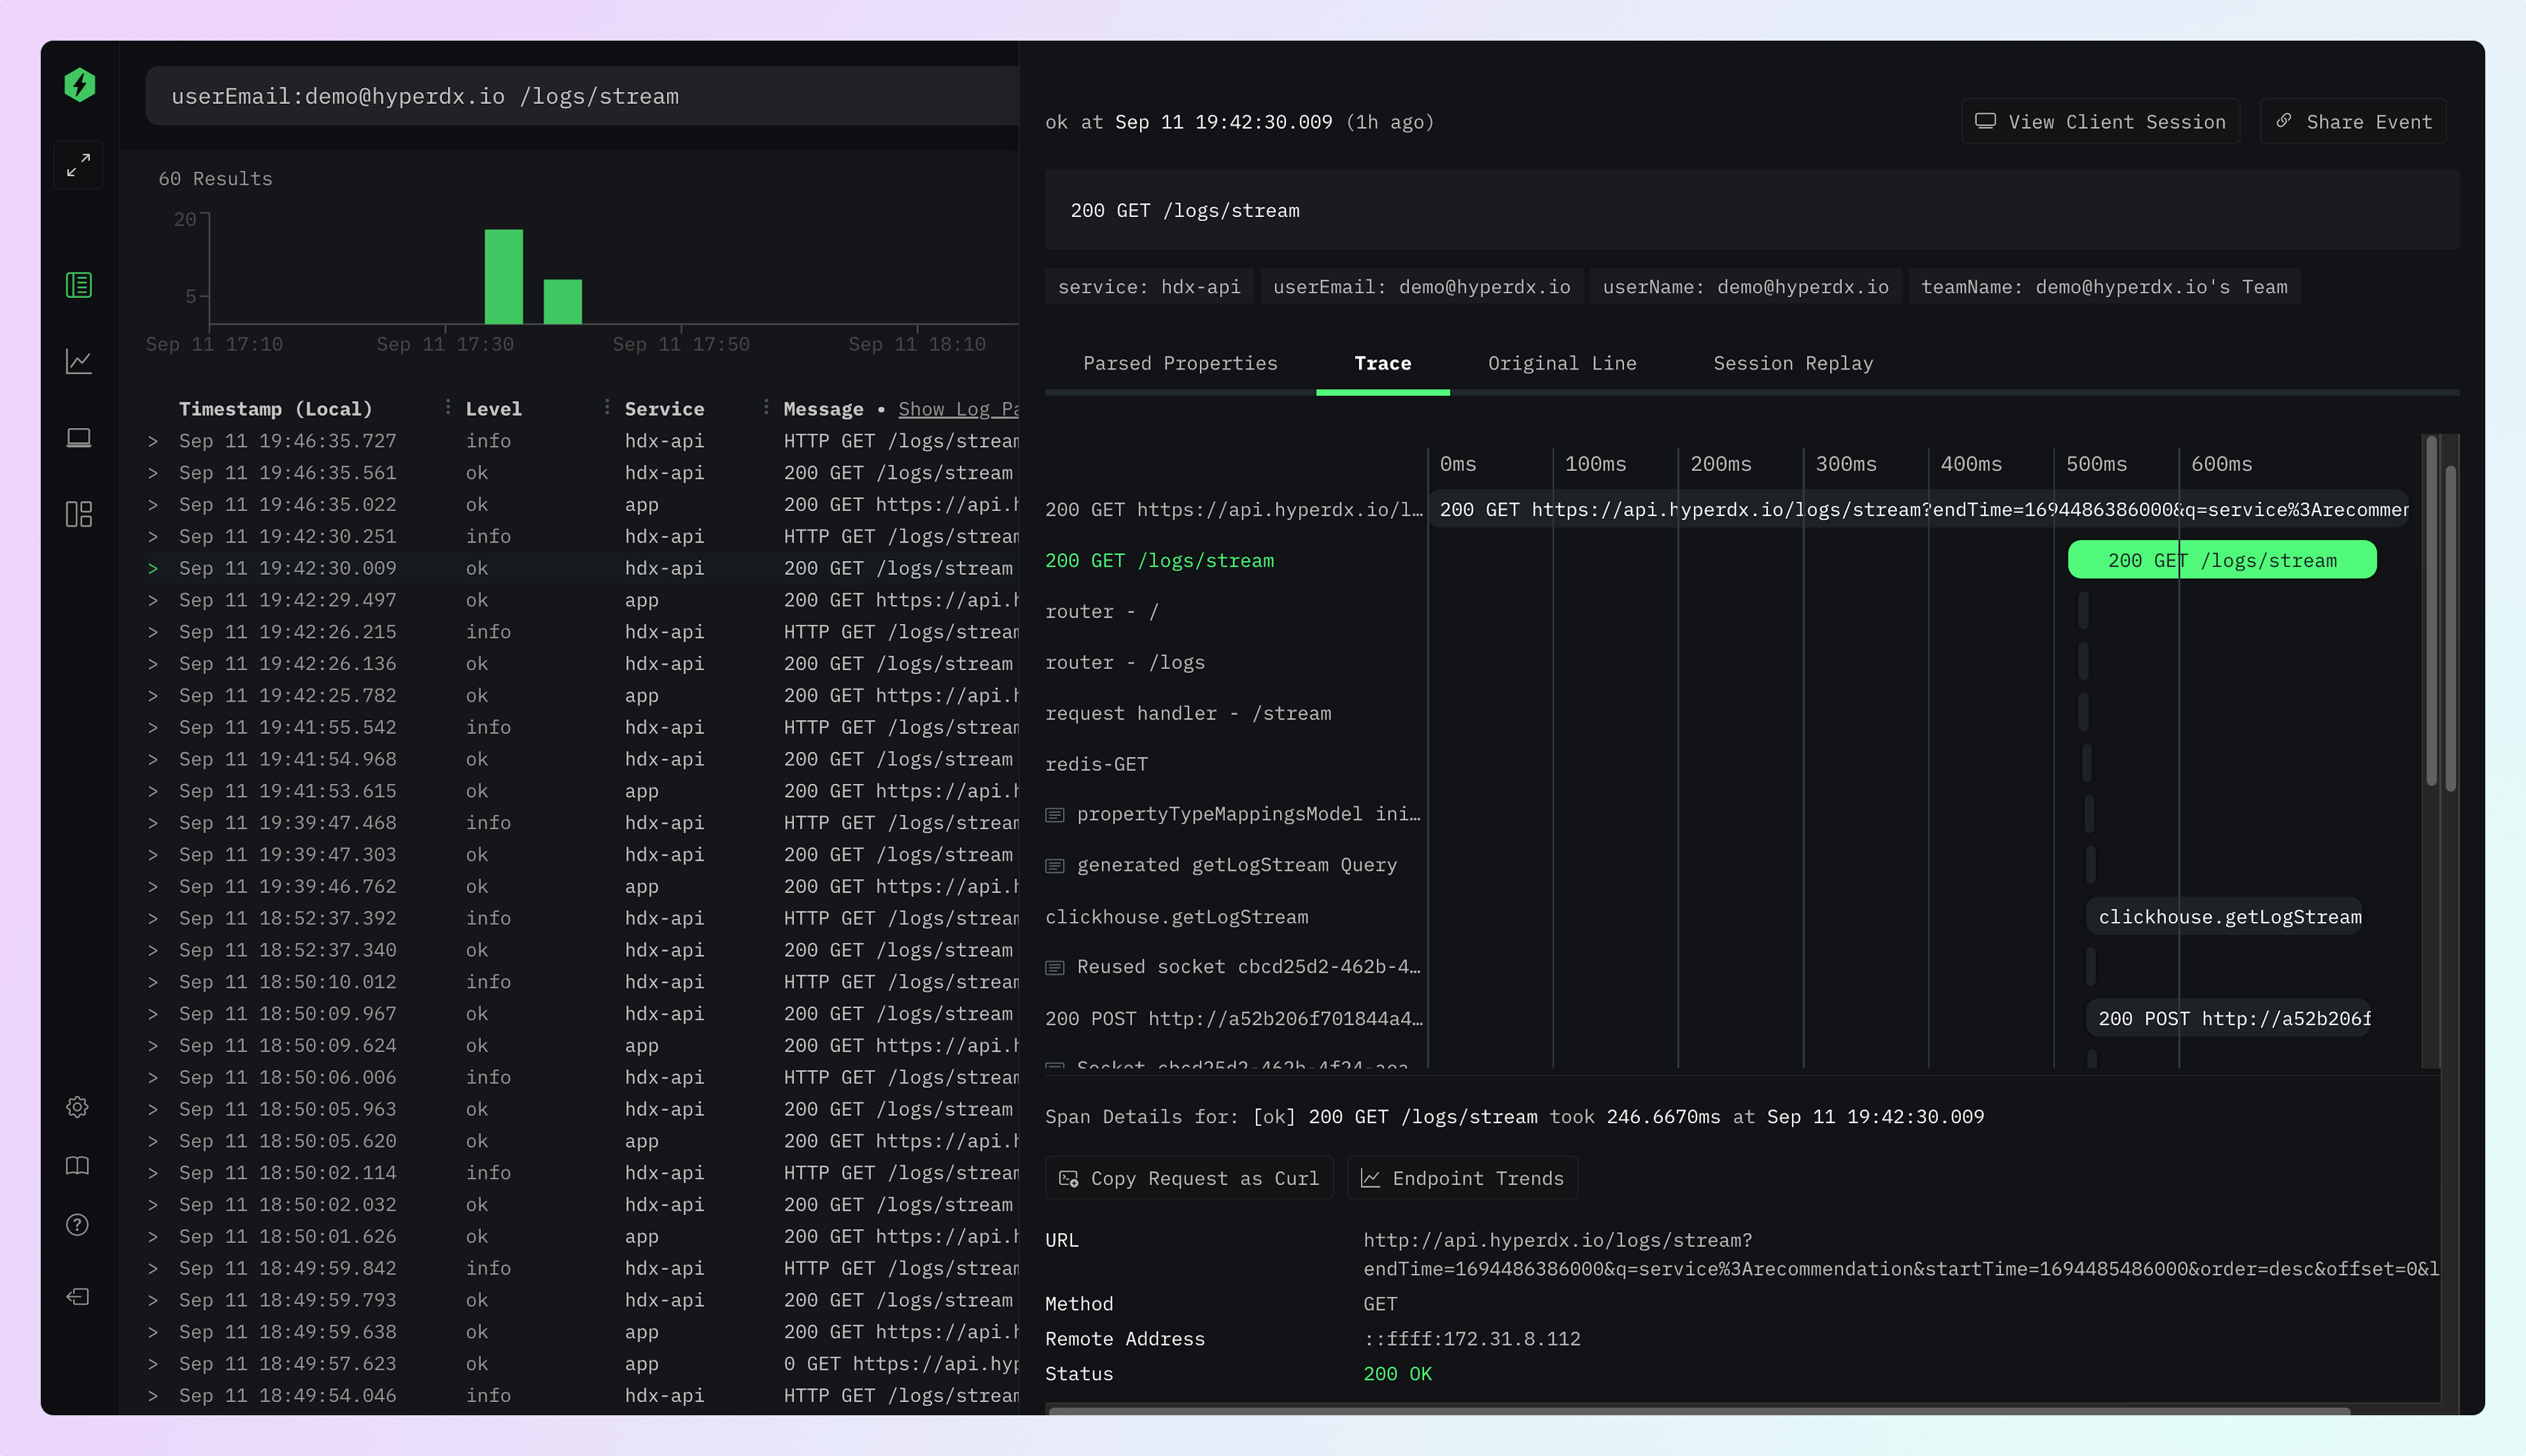
HyperDX
HyperDX is an open-source observability platform designed to resolve production issues swiftly. It unifies session replays, logs, metrics, traces, and errors into a single platform.
This integration provides a comprehensive overview of system performance and issues, aiding in faster problem resolution.
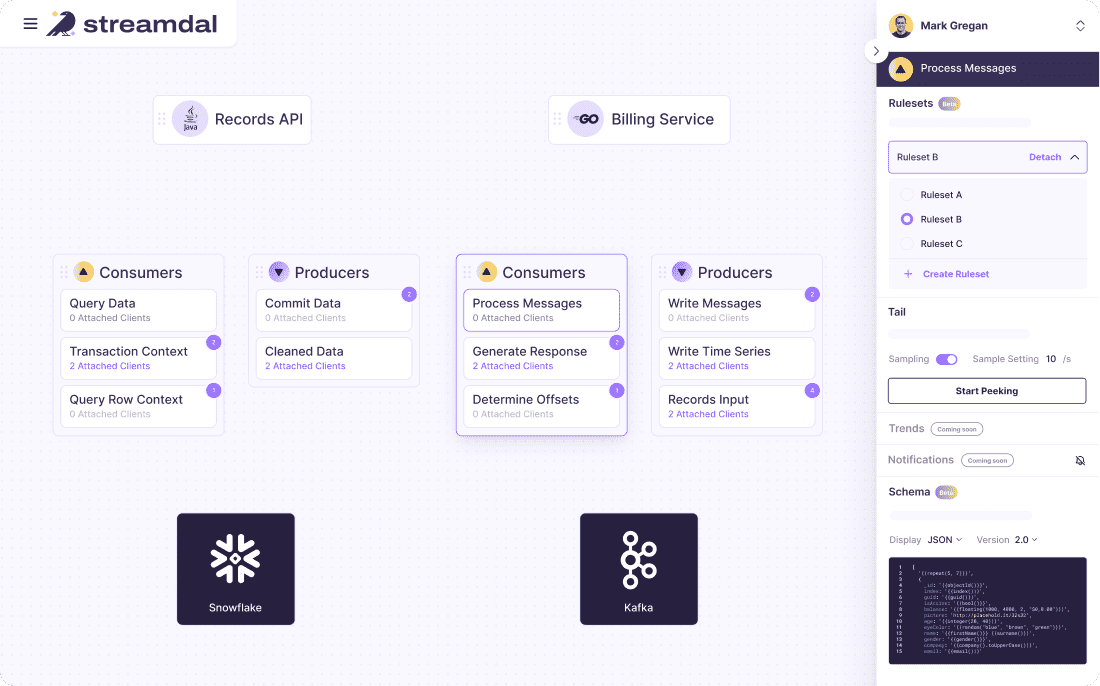
Streamdal
Streamdal is an open-source data observability tool that enables faster detection and resolution of data incidents. It features a data observability graph and rule-based management tool, providing real-time data views with dynamic graph visualization.
Streamdal's monitoring capabilities offer insights into data producers and consumers, helping to understand the status of services and identify data anomalies or throughput irregularities.
Its tail -f functionality allows for viewing real-time data, assisting in root-cause analysis and data compliance auditing.
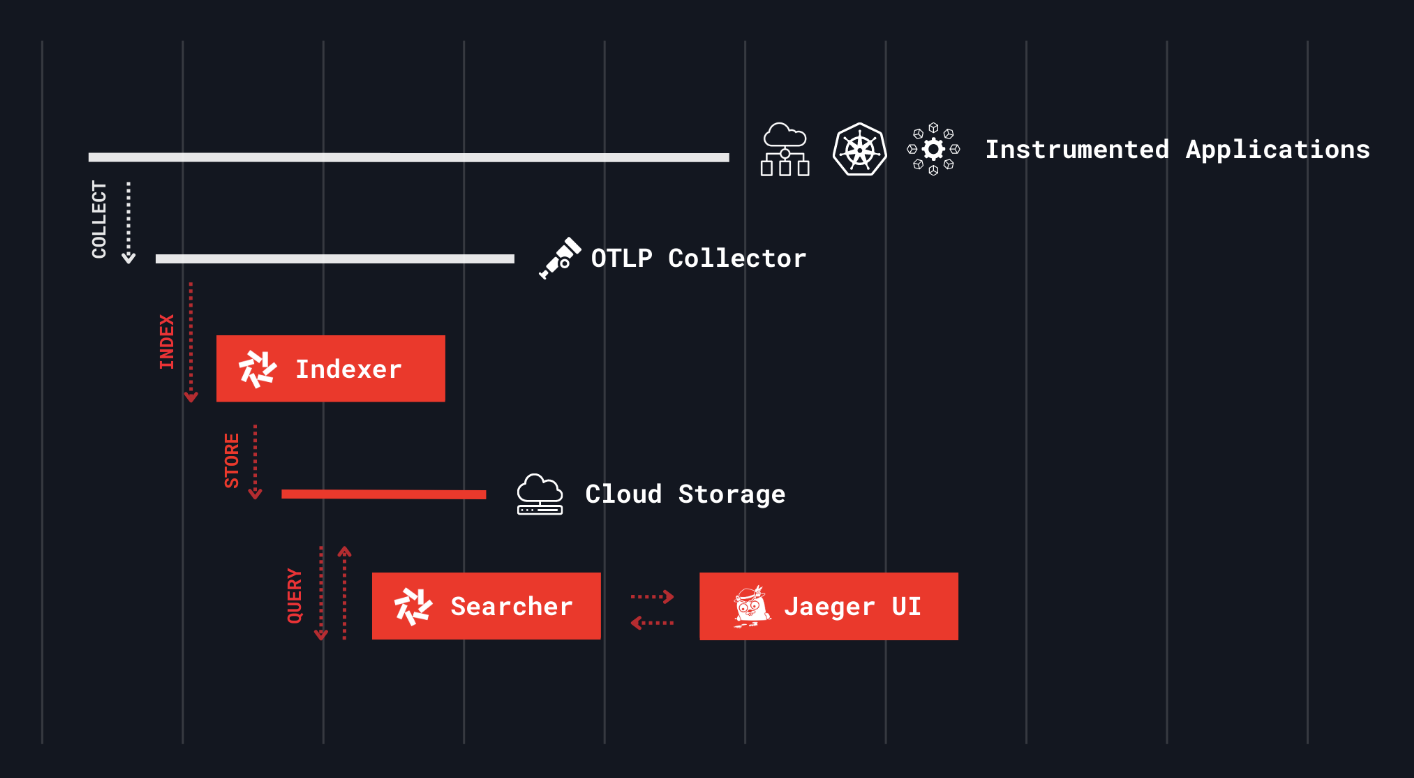
Quickwit
Quickwit is a cloud-native search engine designed for observability, offering an open-source alternative to platforms like Datadog, Elasticsearch, Loki, and Tempo.
It's optimized for searching logs, traces, and soon metrics on cloud storage, aiming to provide a cost-effective and scalable solution for data analysis and observability.
Pros
- Cloud-native, optimizing for storage and search efficiency on cloud platforms.
- Open-source, providing flexibility and community support.
- Compatible with Elasticsearch API, easing migration from existing setups.
- Designed for high scalability and cost-effectiveness.
Cons
- Being a newer tool, might have a smaller community and less third-party integration compared to established alternatives.
- May require initial setup and learning effort for teams unfamiliar with its architecture.
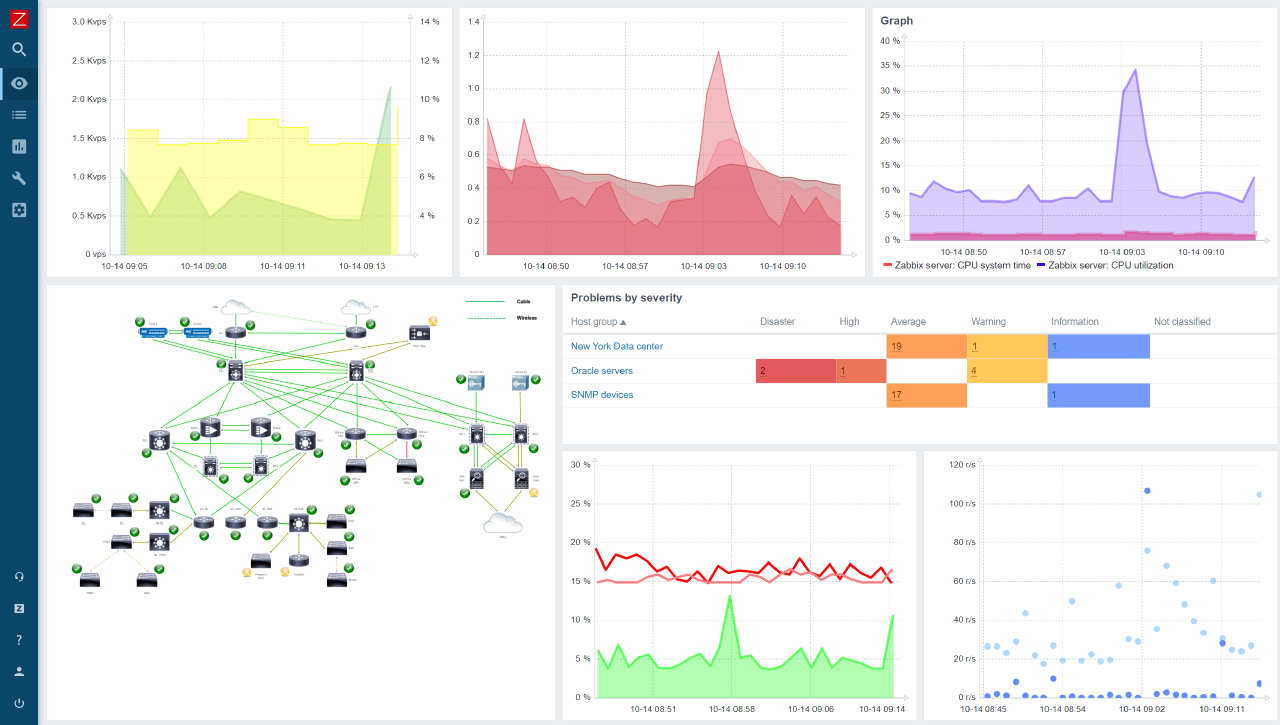
Zabbix
Zabbix uses a client-server architecture, where the Zabbix server collects data from multiple agents installed on network devices, servers, and applications. It can also collect data from other sources such as SNMP traps, JMX counters, and IPMI-enabled devices.
Zabbix supports a wide range of data collection methods, including simple checks like ping, HTTP, and SMTP checks, as well as more advanced checks like SNMP, JMX, and IPMI checks. It also supports custom checks, which can be used to monitor the performance of custom applications and services.
Pros
- Rich in features, a lot of possible Integrations, out-of-box templates and multi-tenancy support, powerful API, supports most monitoring protocols for networks, servers, services, applications, and IoT. Can monitor pretty much everything using standard protocols of custom scripts.
Cons
- Initial setup requires a lot of work, and a lot of optimization is needed in the long run. The documentation isn't so clear for first-timers, especially when common issues arise during installation or post-installation administration.
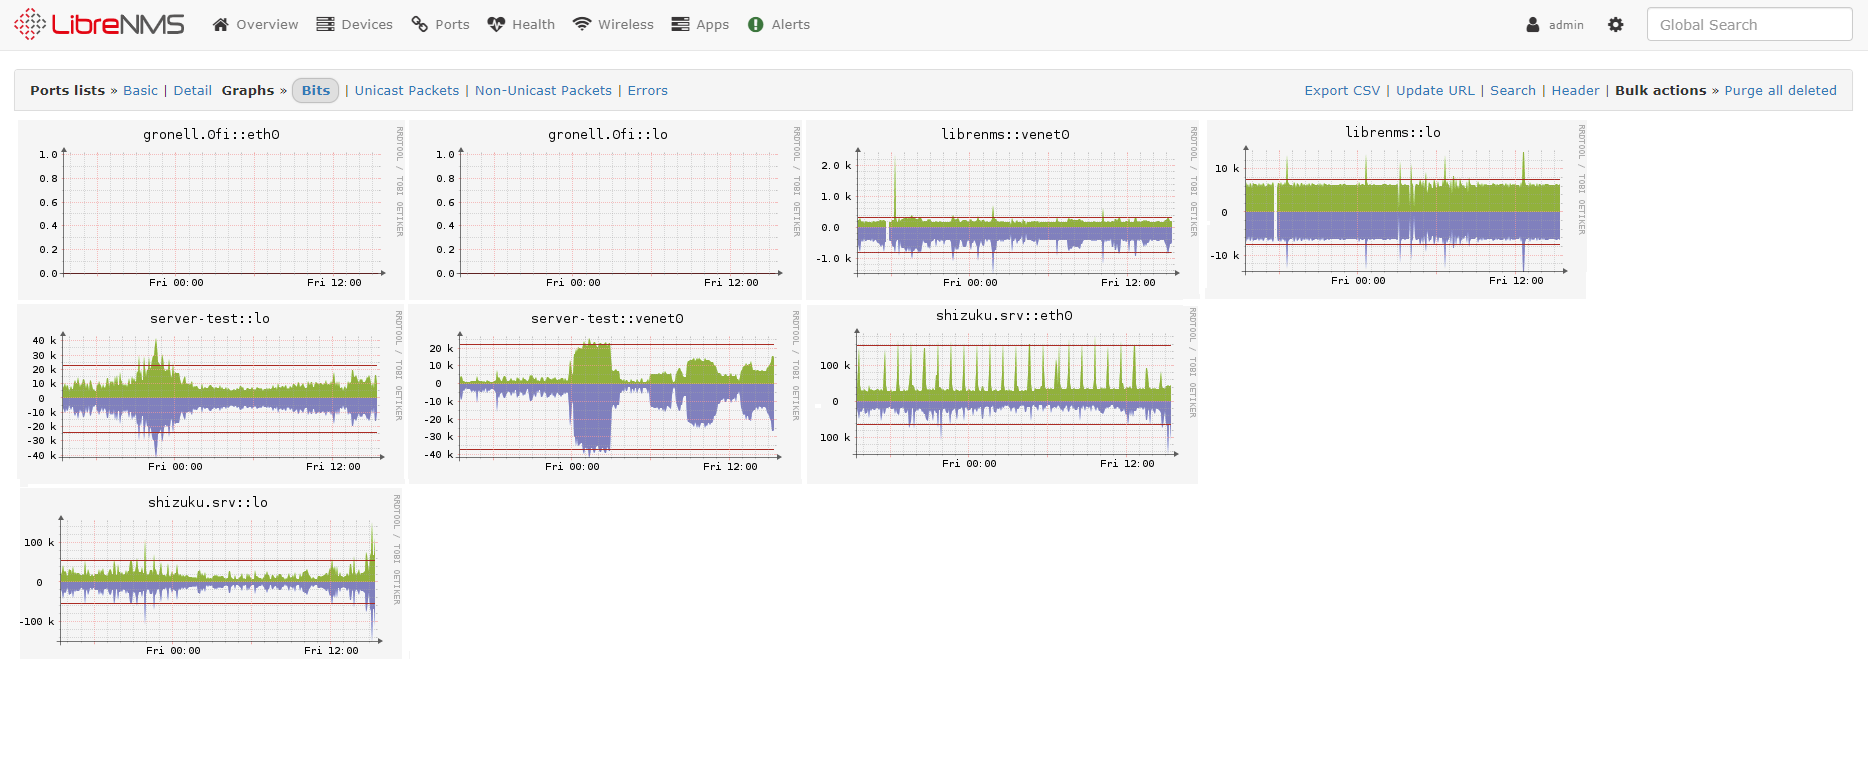
LibreNMS
LibreNMS is a community-based, GPL-licensed network monitoring system. It's designed for auto-discovery and supports a wide range of network hardware and operating systems, including Cisco, Linux, FreeBSD, Juniper, Brocade, Foundry, HP, and many others.
The project emphasizes contribution, user focus, and a welcoming environment for all participants. Documentation, including installation and contribution guidelines, is readily available.
- Open-source and fully GPL-licensed, making it free to use.
- Supports a wide range of devices and operating systems.
- Features auto-discovery for efficient network monitoring setup.
- Community-focused with a welcoming environment for contributions.
Cons:
- May require technical knowledge for initial setup and customization.
- Community support varies; might not be as immediate as commercial support.
Healthchecks.io
Healthchecks.io is a service for monitoring cron jobs and similar periodic processes.
- Healthchecks.io listens for HTTP requests ("pings") from your cron jobs and scheduled tasks.
- It keeps silent as long as pings arrive on time.
- It raises an alert when a ping does not arrive on time.
Healthchecks.io is not the right tool for:
- monitoring website uptime by probing it with HTTP requests
- collecting application performance metrics
- log aggregation
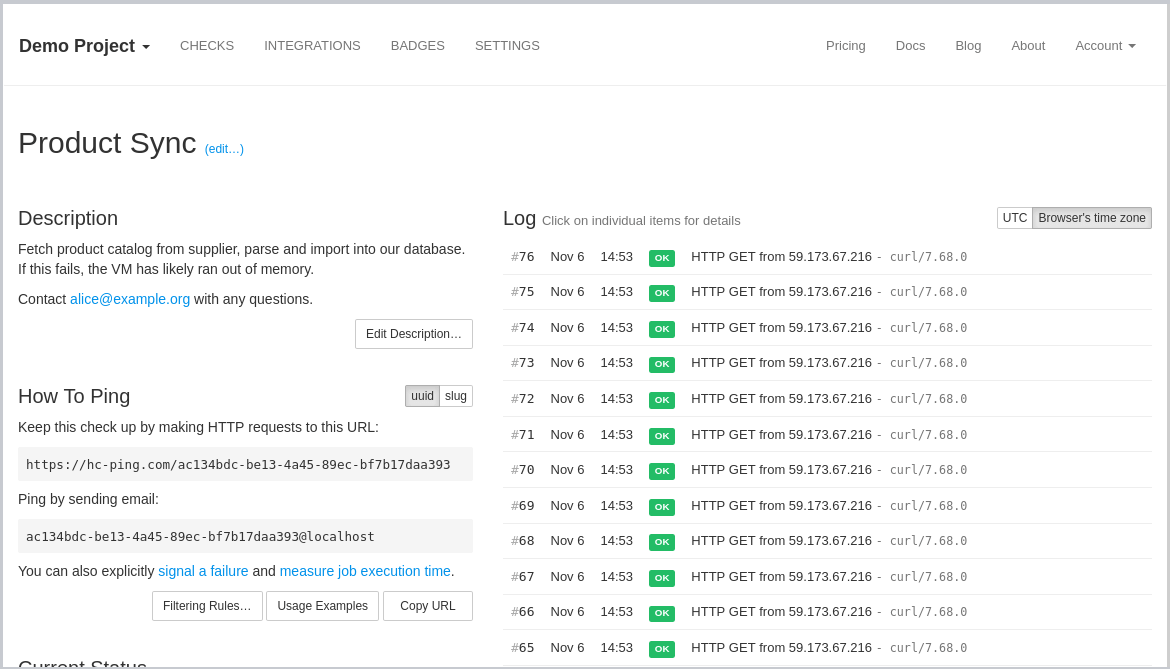
Top Features
- Open source, can be self-hosted
- Simple, clean dashboard
- Team & API access
Pros
- The interface is extremely simple to set up, with clear instructions for implementation.
- Within 5 minutes, you can have notifications when your server fails to report and when the server returns online.
- At the end of the month, you'll have an email report with your downtime.
Cons
- The service lacks advanced analytics and other advanced features.
- Those seeking such features may not find it to be a good fit. However, I believe that the simplicity of this service is a bonus. Adding more features could potentially detract from the excellent user experience.
Healthchecks.io Github repository →
Sensu Go
Sensu Go is an open-source monitoring tool that allows you to monitor your infrastructure, including servers, containers, and cloud services. Sensu has 3 key points: Simple, Scalable, and Multi-cloud monitoring.
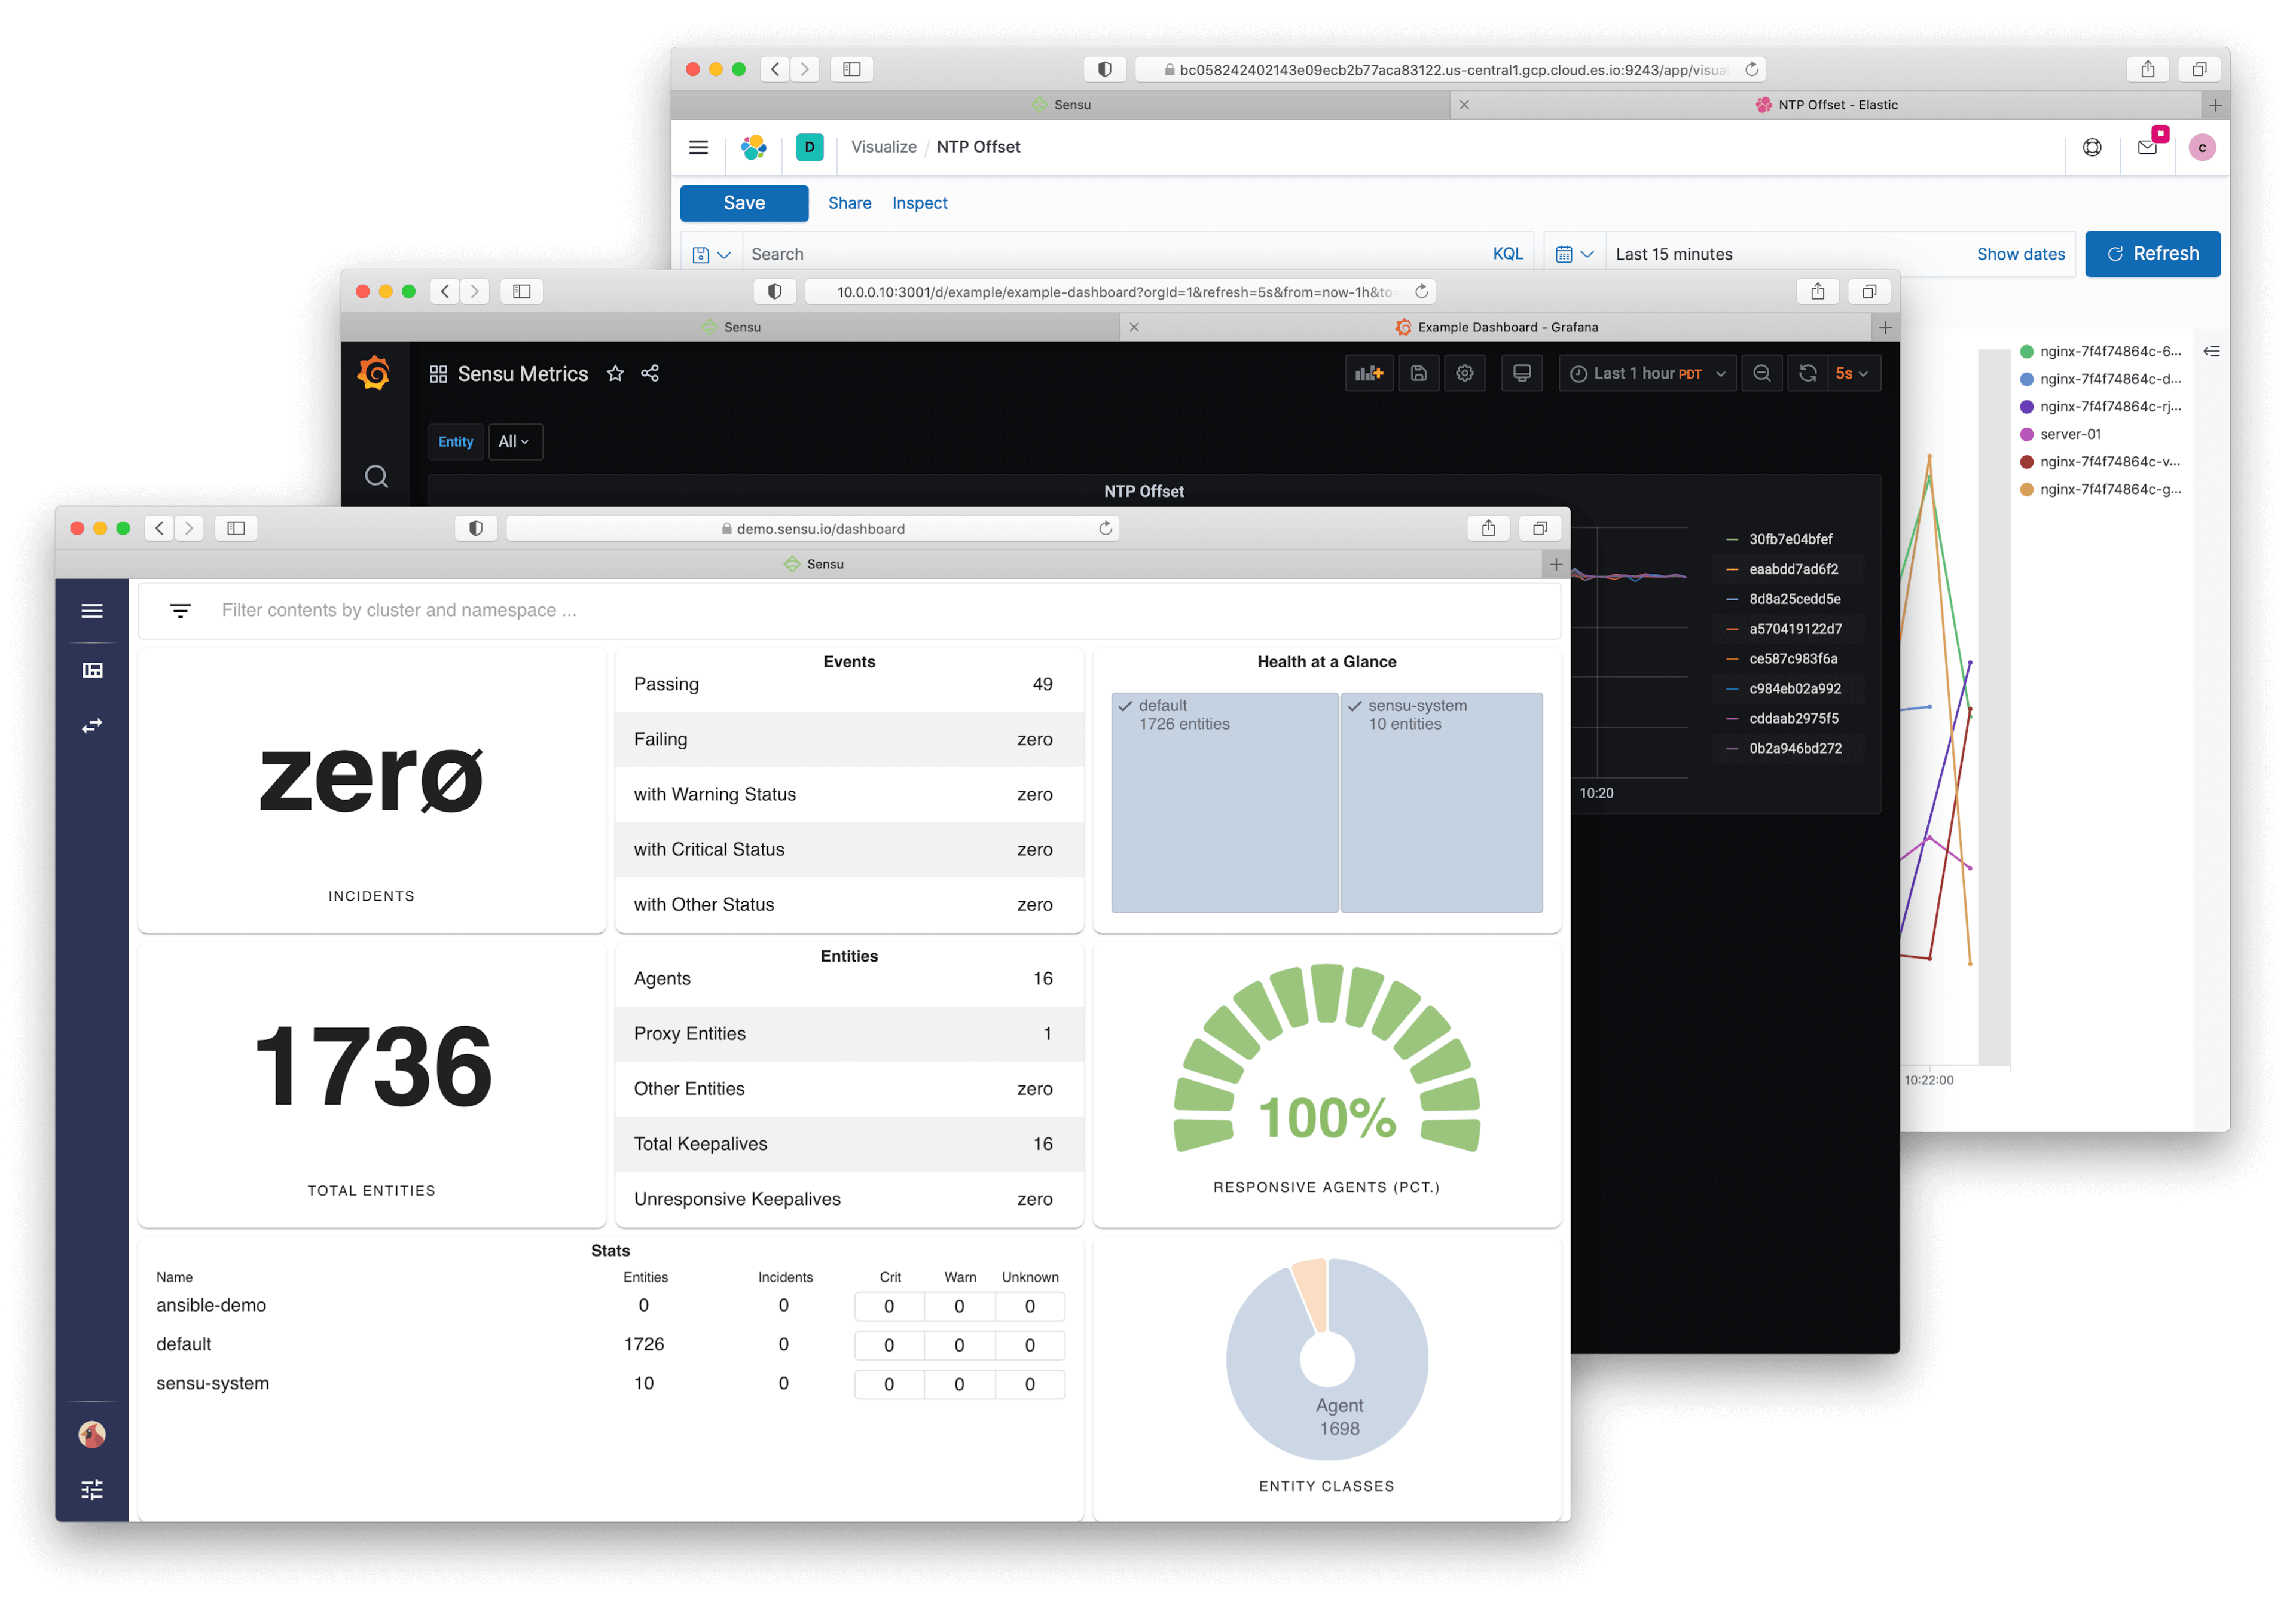
Sensu Go uses a decentralized architecture, where the monitoring checks are executed on client nodes called agents, and the results are sent to a backend server for processing and storage. This architecture allows for a more flexible and scalable monitoring setup, where you can add or remove agents as needed and distribute the monitoring workload across your infrastructure.
Sensu provides the Monitoring-as-Code functionality and automation that are essential for such dynamic environments ranging from completely automated deployment based on monitoring code templates (YAML configuration files), to flexible APIs to control all elements of the monitoring platform.
Sensu Go supports various types of monitoring checks, including Nagios-style checks, custom scripts, and plugins written in various languages. You can also use Sensu Go to monitor containerized environments such as Kubernetes and Docker, as well as cloud services such as AWS and GCP.
Pros
- Developers can code their own checks
- Easy configuration, scales well, and performance is good
- Message routing
- Nagios plugin compatibility
- Written in Go
Cons
- Not a very good UI
- Sensu Go has a learning curve, and it may take some time for users to become familiar with its functionality and configuration options.
SigNoz
SigNotz is an open-source APM (application performance monitoring) tool that you can use as an alternative to other tools like Datadog and NewRelic. It can come in very handy to monitor your applications and troubleshoot problems.
Furthermore, SigNoz integrates OpenTelemetry, supporting various languages and frameworks that implement it, like Java, Ruby, Python, Elixir, and much more. It supports various modern technologies and frameworks such as Kubernetes, Istio, Envoy, Kafka, gRPC, and more.
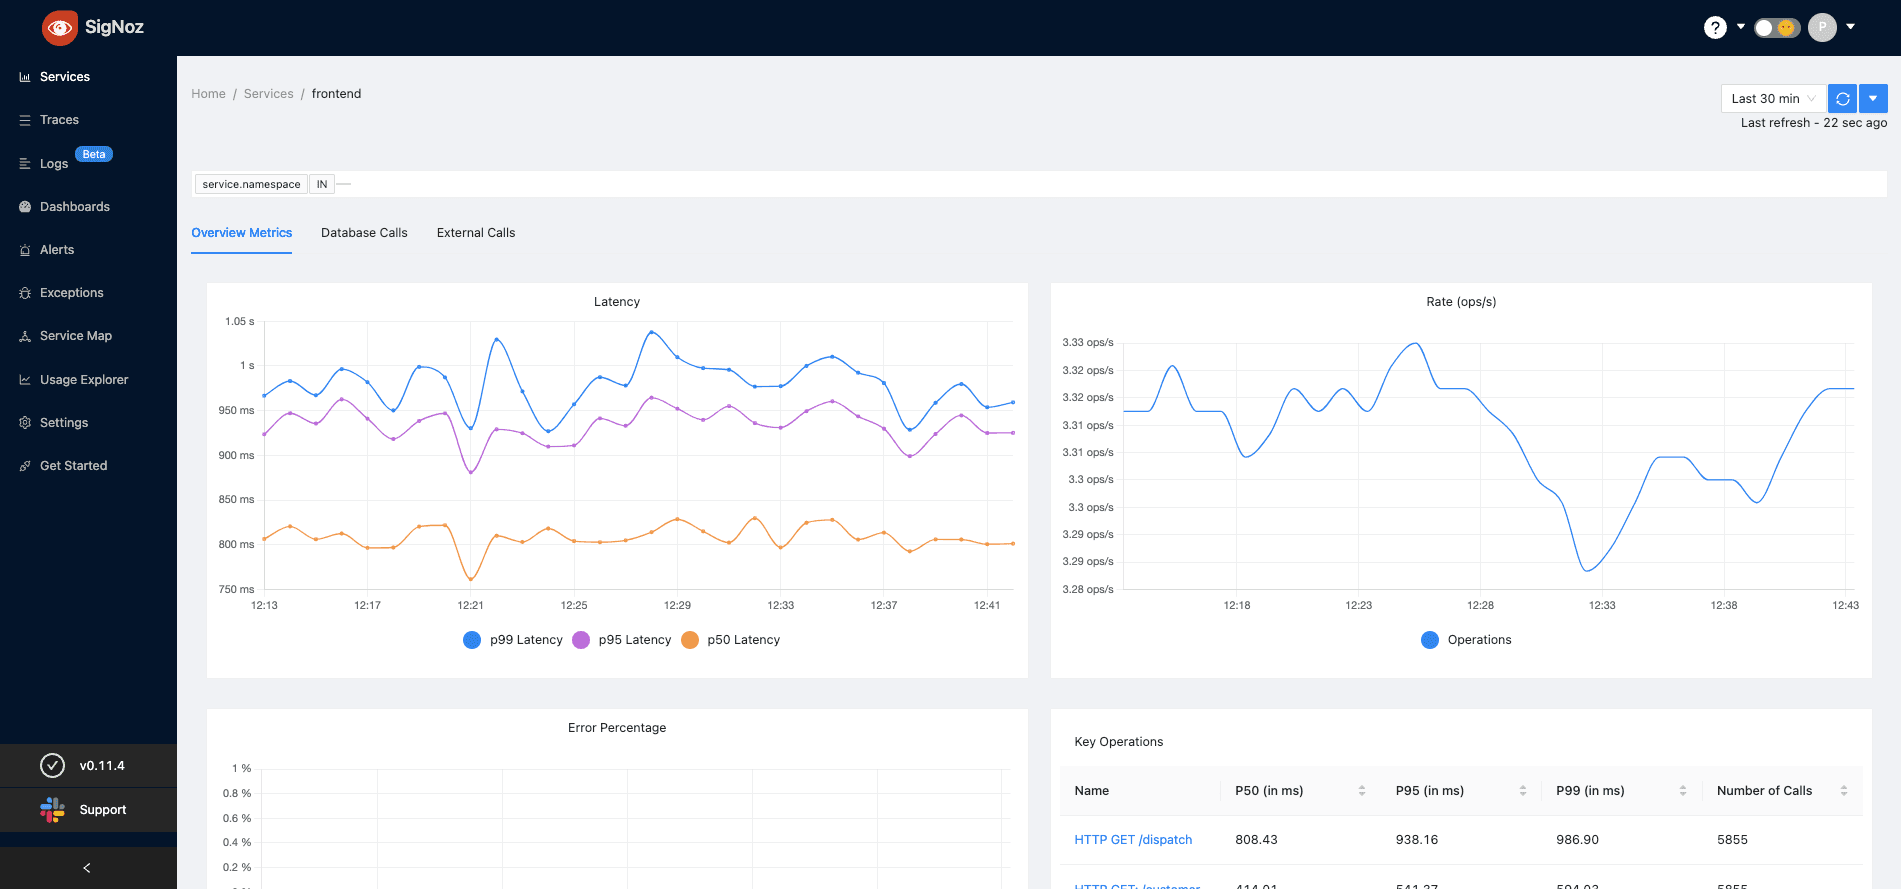
Top Features
- Monitor application metrics such as latency, requests per second, error rates.
- Monitor infrastructure metrics such as CPU utilization or memory usage.
- Track user requests across services.
- Set alerts on metrics.
- Find the root cause of the problem by going to the exact traces which are causing the problem.
- See detailed flame graphs of individual request traces.
Conclusion
Today's complex technological landscape requires flexible monitoring & observability tools for DevOps that are both robust and cost-effective. Open-source solutions, such as those presented above, offer many advantages, from transparency and customizability to cost-effectiveness and community support.
However, it's important to consider factors like system complexity, technical expertise, scalability, and budget when choosing the right tool for your DevOps team. Keep an eye on the latest developments and updates in these tools to ensure your team is equipped with the best resources for maintaining system performance, reliability, and security.
Choose wisely to empower your team with the information they need to make the best decisions and take effective actions.
StatusPal provides powerful incident communication & monitoring tools tailored to effective DevOps teams. Check out our Monitoring & Automations features.
Eduardo Messuti
Founder and CTO
Eduardo is a software engineer and entrepreneur with a passion for building digital products. He has been working in the tech industry for over 10 years and has experience in a wide range of technologies and industries.
See full bio


Getting started
Ready to streamline incident communication?
Give StatusPal status pages a test drive.
The free 14-day trial requires no credit card and includes all features.